The numbers paint a picture
February 13, 2009
2008-2009 PPS student migration
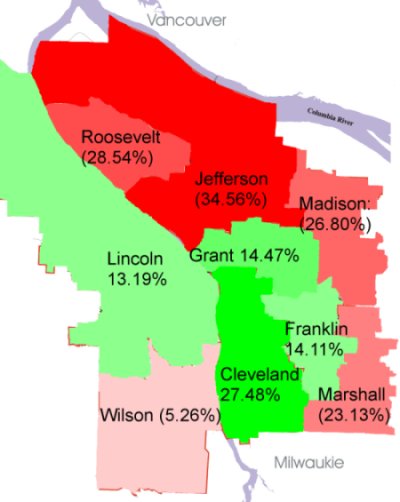
Percentage of enrollment gained (or lost) due to student migration (compared to cluster population)
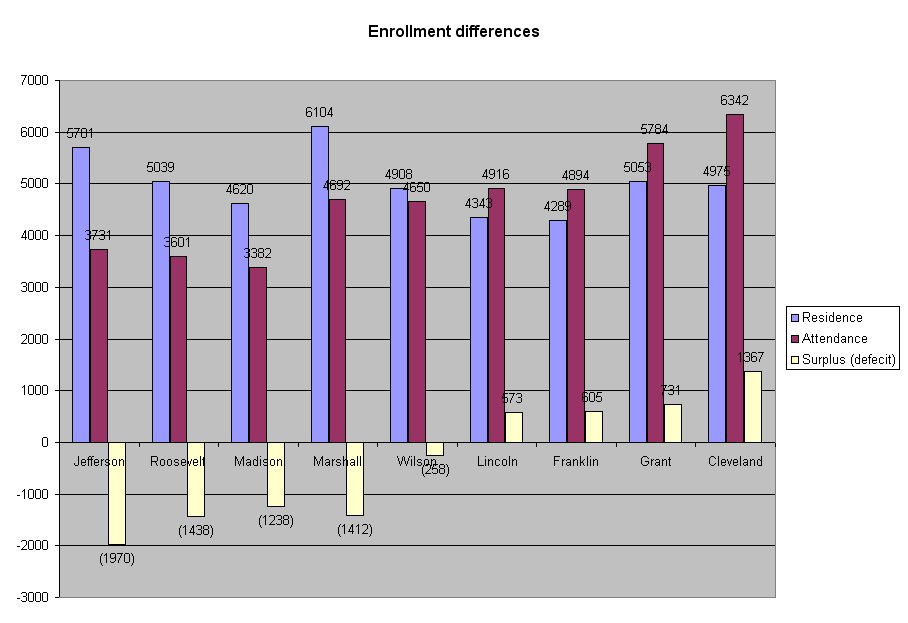
Student population vs. enrollment
Availability of comprehensive secondary schools correlated with race and poverty
| cluster | # comp. high schools | # comp. middle schools | % non-white by residences | % free/reduced meals by residence |
|---|---|---|---|---|
| Jefferson | 0 | 0 | 67.48% | 61.39% |
| Roosevelt | 0 | 1 | 67.6% | 72.30% |
| Madison | 0 | 0 | 61.95% | 61.77% |
| Marshall | 0 | 1 | 57.96% | 72.79% |
| Wilson | 1 | 2 | 24.57% | 20.80% |
| Lincoln | 1 | 1 | 21.60% | 9.30% |
| Franklin | 1 | 1 | 35.05% | 38.52% |
| Grant | 1 | 2 | 32.85% | 23.17% |
| Cleveland | 2 | 2 | 27.16% | 30.15% |
Note: teacher experience and student discipline rates also correlate highly to race and poverty; that is, average teacher experience is lower and discipline referral rates higher in schools serving high poverty, high minority populations. Data for the current school year are not yet available for these factors.
Data source: Portland Public Schools.
This report is available in PDF format (240KB).
Steve Rawley published PPS Equity from 2008 to 2010, when he moved his family out of the district.