Category: Data Crunch
March 1, 2010
by Carrie Adams
The Portland Public School board is scheduled to vote March 8th on a program that would allow military recruitment, under the guise of science education, of PPS kids in grades K-5. The program (STARBASE) has been in Portland schools since 1993. PPS receives just over $300,000 per year for providing access to the kids.
STARBASE and the district’s claim that there’s a need for this particular program or that it’s an effective way to teach science is weak at best.
In 2001, PPS was awarded a $4,964,861 five year National Science Foundation (NSF) grant with these goals:
- to enable all of the district’s diverse student enrollment to meet rigorous K-12 standards in science and mathematics and prepare for postsecondary education and future careers;
- to increase the district’s capacity to develop, support, and sustain teacher and principal leadership;
- to engage families and the community in supporting improved student performance in science and mathematics and improved access to high quality, inquiry-based educational opportunities; and
- to establish ongoing collaborative partnerships with higher education, business/industry, policy makers, and other key stakeholders in support for exemplary, research-based teaching and learning in science, mathematics, and technology within the context of a large and diverse urban district.
In a 2004 PPS grant report, PPS makes the following claims about the NSF program:
- In science, NSF schools made a gain of 6% in 5th grade, 6% gain in 8th, and 9% gain in 10th grade, compared to district growth of 4%, 4%, and 9%.
- Minority students improved in science in the NSF schools faster than whites. The percentage of 5th grade African American students who met standards increased from 36% from 47%, compared to whites that increased from 79% to 81%.
- Hispanic students have traditionally not performed well in math and science. This year, many of them improved particularly in science. In NSF schools, the number of Hispanic students who met standards increased from 37% in 5th grade to 46%, from 25% to 34% in 8th, and from 20% to 27% in 10th.
Inverness Research Associates conducted annual evaluations of the NSF grant. The October 2006 final report states:
In our view, the Portland USP can readily claim success with developing greater teacher leadership capacity for math and science education improvement in their district. Their theory of action – of how to achieve increased capacity – was sound. First they focused on creating change “from the bottom up,” instead of from the top down. The USP also sought to make lasting changes to teachers’ beliefs, recognizing that ultimately the individual is the unit of change. Changes that reside within the individual teacher, that is – their ways of thinking and teaching and learning vis-à-vis math and science education – are, therefore, lasting legacies. Schools come and go, and staffs and principals and reform foci also shift frequently in large urban districts. Given that reality, seeking to create changes from the bottom up, and individual-to-individual, are strategies that promise a greater likelihood of sustainability. Also when robust vision, commitment and skills reside locally at the school level, the work of improvement in math and science is more likely to continue in spite of district change. Finally it is important to point out that teacher leadership capacity does not disappear. It is a renewable resource, a districtwide (though often invisible) asset that can be harnessed and directed for worthy purposes. The development of indigenous teacher leadership is, therefore a wise, ecological model for improvement.
Inverness Research Associates’ final report indicates that the program was a big success. The conclusion is too lengthy for a blog but these are the highlights.
Given the relatively small scale of the USP investment, roughly $20 per student per year, it has reaped enormous benefits, leaving behind a host of tangible and intangible assets in the district. To name the most significant of these assets are: a well-honed, highly respected and very experienced leadership team for math and science; a district-wide group of teachers and teacher leaders committed to math and science improvement; a cadre of classroom teachers with vastly improved skills and knowledge in math and science teaching, as well as skills and knowledge about how to work together to provide and continuously improve high quality programs for students; systems and structures organized to deliver and maintain curricular materials; a strategically designed, well-crafted professional development program; a clearly articulated and commonly held vision for high quality math and science education which lends coherence to efforts for improvement at multiple levels of the system; and finally, the accumulated good will and success of the USP effort which enables people to continue to work hard and with optimism toward their shared goals even in difficult circumstances.
So given PPS own data and reports and an evaluation conducted by an outside organization, the NSF program was effectively closing the achievement gap in math and science and PPS could have easily sustained the effort for $20 per year per student.
Why is PPS now offering up the very same groups of kids supported by the NSF grant to the military for a mere $300,000 in a weak, non-sustainable so-called science program? Have they dismantled the infrastructure that was so effective for poor and minority children?
It just makes my point in the previous post that PPS is unwilling to close the gap. The bottom line is that PPS poor kids are the district’s contribution to the war efforts.
 Sourced from: Cheating in Class. Used by permission.
Carrie Adams blogs at Cheating in Class.
No Comments
February 22, 2010
by Carrie Adams
I’m glad that so many people are able to see through Superintendent Smith’s disingenuous claim to be redesigning high schools in an effort to close the achievement gap and address equity concerns.
It’s bad enough that PPS screws poor kids out of an even marginally adequate education but to use poor kids in their plan to close schools is shameful.
That said, there may or may not be a need to close schools. District administrators are so dishonest it’s hard to know what’s the truth.
Last year 63% of white students and 35% of black students were on track to graduate in 9th grade. On track being defined as earning 6 or more credits with grades C or above by the end of their freshman year.
There was a 31% difference in Math and 27% difference in the English state test results between white students and the lowest subgroup. African American students continue to be suspended or expelled at almost 3 times their population rate.
Other than changes in school assignment, what’s in the high school redesign plan to address the achievement gap?
PPS administrators would rather shake up entire communities than try smaller, common sense approaches to closing the gap.
Here’s a radical idea worthy of trying….school principals could USE the federal Title I dollars allocated for their schools. Even crazier…they could use it according to their School Improvement Plans. That’s the plan that they were supposed to have created in collaboration with parents and staff. According to a PPS Title I-A Report dated 1/26/10:
Each school is required to complete a School Improvement Plan that contains strategies to increase the student achievement of educationally disadvantaged students. The plan must include a needs assessment, prioritization of needs and SMART (student-centered and specific, measurable, attainable, realistic and time bound) goals for the school.
Who from PPS administration has followed up on the School Improvement Plans?
For years, PPS Title I school principals have failed to use the Title I money allocated for improving the academic program for disadvantaged students. Title I funds are allocated annually. Historically, the amount remaining at the school level at the end of the school year has been between $500,000 and $750,000 collectively.
Scott leads the list of schools with unspent Title I funds. In 2007/08, Scott had almost $73,000 remaining at the end of the year. The amount left unspent in 2008/09 decreased to $49,674. Even so, less than half of Scott’s black students met benchmarks in reading or math.
At the district level, Title I underspending looks even worse.
For the 09/10 school year, the district was allocated $18,883,118 in Title I-A funding and $14,569,092 in American Recovery and Reinvestment Act (ARRA) Title I funding. In addition the district carried over $2, 845,562 from the previous school year for a total budget of $36,297,772 for this school year.
It’s not likely that the district will use the almost $3 million carried over from last year because the 09/10 allocation is even higher than last year’s.
The carryover from 08/09 includes $180,000 for optional parent engagement and $1,200,000 for AYP School Support. What services could have been provided with that?
The amount remaining at the end of the 08/09 school year for each Title I school is listed below. Amounts listed in () are negative amounts meaning those schools overspent:
Astor $6,544
Beach $7,562
Boise Eliot $4,954
Chief Joseph $31,476
Clarendon $54,882
Humboldt $(629)
James John $7,739
Markham $2,628
Rosa Parks $8,833
Ockley Green $(358)
Peninsula $16,493
Sitton $10,761
Arleta $16,149
Atkinson $32,306
Bridger $5,936
Clark $27,829
Creston $9,316
Faubion $5,280
Grout $13,788
Kelly $4,876
Irvington $(988)
King $33,178
Lee $11,023
Lent $(5,064)
Lewis $10,261
Marysville $8,438
Rigler $39,088
Roseway Heights $4,535
Sabin $9,573
Scott $49,674
Vernon $7,402
Vestal $13,806
Whitman $6,864
Woodlawn $2,142
Woodmere $14,874
George $11,956
Beaumont $11,505
Hosford $19,669
Lane $3,378
Jefferson HS $33,896
BizTech $31,351
ACT HS $17,500
SEIS HS $9,764
POWER HS $24,962
PAIS HS $4,380
Renaissance HS $26,784
So you see, PPS has had the money to improve the quality of education provided to poor children but they’ve failed to use it. They’ve also failed to include all of the required partners in creating School Improvement Plans.
In addition to the problem with Title I spending, PPS lost $617,000 for English Language Learner students because they failed to comply with civil rights laws. English Language Learner students are also kids at the bottom end of the achievement gap. PPS had more than 20 years to comply with the Office for Civil Rights findings but failed to do so.
Now, we’re expected to believe that PPS is sincere about closing the achievement gap. Not a chance.
Sourced from: Cheating in Class. Used by permission.
Carrie Adams blogs at Cheating in Class.
31 Comments
February 11, 2010
by Steve Rawley
Demographic information readily available from the district does not provide a fine-grained detail of fourth- and fifth-grade students targeted by the military’s STARBASE recruiting program, but it is clear that poor and minority students are over-represented.
Of the 18 schools participating this year, all but four are Title 1 schools. All but three have higher percentages of minority students than the district-wide minority enrollment (46%). All but four have higher poverty than the district at large (45%).
The schools participating average 11 percentage points more minority and 17 percentage points more poor than the district as a whole, even when factoring in the four wealthy schools that participate.
While many participating staff and families may swear there is no recruiting going on, the program is funded from the US Department of Defense recruiting budget. The military is clear about their need to target potential recruits early.
Student information is shared with the military with little or no notice to parents (or opt-out opportunities), and the program is explicit in its goals of improving the image of the military with young children.
Here are the schools participating this year, with their demographic information.
| School |
free/reduced % |
minority% |
Title 1 |
| Humboldt |
100.00% |
88.40% |
yes |
| Rosa Parks |
94.80% |
85.60% |
yes |
| Rigler |
86.10% |
79.00% |
yes |
| Peninsula |
78.10% |
73.00% |
yes |
| James John |
79.70% |
72.80% |
yes |
| Faubion |
70.70% |
69.70% |
yes |
| Whitman |
86.70% |
68.80% |
yes |
| Lee |
71.70% |
67.70% |
yes |
| Marysville |
80.30% |
59.00% |
yes |
| Bridger |
74.10% |
58.10% |
yes |
| Grout |
70.20% |
50.70% |
yes |
| Woodstock |
27.30% |
50.30% |
no |
| Arleta |
66.40% |
47.90% |
yes |
| Markham |
54.70% |
47.80% |
yes |
| Irvington |
34.60% |
47.70% |
yes |
| Buckman |
28.70% |
23.10% |
no |
| Cleary |
14.40% |
19.70% |
no |
| Laurelhurst |
10.60% |
19.30% |
no |
| Averages: |
62.73% |
57.14% |
|
| District: |
45.00% |
46.00% |
|
Steve Rawley published PPS Equity from 2008 to 2010, when he moved his family out of the district.
1 Comment
January 8, 2010
by Steve Rawley
School board member Bobbie Regan may be signaling opposition to proposed limits to neighborhood-to-neighborhood student transfers, according to a report by Beth Slovic on Willamette Week‘s news blog.
Regan’s apparent expression of unease with the proposal, which is part of a larger redesign of the high school system, comes on the heals of an Oregonian editorial Monday which expressed more direct opposition to the idea of limiting the flow of students and funding.
Each year, thousands of students and tens of millions of dollars in education funding transfer from Portland’s poorest neighborhoods and into its wealthiest. Schools in the Lincoln cluster home to Regan and the wealthiest familes in Portland Public Schools, had a net gain of nearly 600 students in 2008-09, representing over $3 million in funding.
In that same school year, schools in the Jefferson cluster, encompassing some of Portland’s poorest families, lost nearly 2,000 students and about $12 million to out transfers.
Steve Rawley published PPS Equity from 2008 to 2010, when he moved his family out of the district.
9 Comments
December 10, 2009
by Steve Rawley
Discussion on the recent article PPS and the philanthro-capitalists touched on the inequities engendered by local school foundations. That discussion raised a couple common misconceptions about direct funding of schools, which I’d like to dispel.
1. “…my guess is that the [Title 1 funds] lower income schools receive equal, if not exceed, the amounts raised by foundations.”
If you browse through the school profiles published by the district, it’s easy to see where one could come up with this idea. In general, rich schools have positions funded by local school foundations (LSFs) and poor schools have Title 1 money. There are two problems with this assumption. First, it’s false. Second, even if it were true, it still wouldn’t be equitable.
Looking at dollars-per-student added to school budgets last school year from Title 1, Local school foundations (LSFs) and PTAs, eight of the top 10 schools in per-student additions are non-Title 1 schools: Abernathy, Chapman, Ainsworth, Forest Park, Irvington, Duniway, West Sylvan, Rieke and Stephenson. These schools raised between $273.60 (Stephenson) and $570.03 (Abernathy) per student.
Madison High, with over 65 percent of students qualifying for free or reduced-price meals got no Title 1 money. Benson High, with over 58 percent free and reduced, also got no Title 1 money.
One more example: Ockley Green K-8, with nearly 3 out of 4 students in poverty and 8 out of 10 non-white, got $189.84 per student in Title 1 money, while Ainsworth K-5, with less than six percent on free and reduced lunch and 80 percent white, added over $400 per student. Ainsworth’s teaching staff was increased nearly 33 percent through direct funding by parents.
More importantly, the idea that foundation money would simply supplant Title 1 money is misguided. Title 1 money is provided by the federal government to help ameliorate the problems associated with poverty, and there are very specific guidelines for its use. While foundation dollars reduce class sizes and preserve “enrichments” like certified art and music teachers and advanced college placement programs, Title 1 money is almost entirely spent on academic support (resource rooms, reading teachers, etc.) to help bring disadvantaged students up to grade level .
Even if Title 1 provided the exact same amount of money per student at poor schools as LSF money provides at rich schools, it still wouldn’t be nearly enough to overcome the disadvantages students affected by poverty must overcome, much less be equitable in terms of the kinds of programs schools can afford to provide their students.
2. “…one third of all funds raised goes directly to the Portland Schools Foundation, an umbrella organization that provides grants to close achievement gaps between students throughout the school district. One third to employ educators, a third to enrich our kids and a third to help others. Sounds fair to me.”
When you put it that way, it almost does sound fair. Almost. But there’s a problem with the assumption, and with the math.
First, until this school year, no money from the Portland Schools Foundation’s “Equity Fund” ever paid for a single teaching position at any school. This year, under the leadership of Dan Ryan, schools were finally allowed to spend this money on teaching positions; eight schools were awarded between $20,000 and $55,000. That’s a handful of full-time-equivalent teaching positions for the entire district.
For comparison, in one school year the LSFs at Lincoln High, West Sylvan Middle, Ainsworth Elementary, Forest Park Elementary, Duniway Elementary and Bridlemile Elementary raised $224,680, $198,878, $193,766, $156,684, $113,187 and $110,005 respectively.
The problem with the math of thirds cited here is that only money used to pay for certified teachers is subject to the Equity Fund contributions, and the first $10,000 is exempt. So, for example, let’s say a school raises $150,000 at their auction, and decides to put $50,000 toward a teaching position. They’ll spend the rest on classroom aides, computers, books for the library, classroom supplies, and an after-school arts program, all of which is fully exempt from Equity Fund contributions.
For the teacher they hire, after the $10,000 exemption, they would tithe 30 percent of $40,000, or $12,000, to the Equity Fund. That’s eight percent of their total funds raised, not a third.
To be clear, nobody should be discouraged from supporting their kids’ school. But the system we have today is grossly unfair. Local school foundations have allowed wealthy neighborhoods to preserve pretty decent “public” schools while the rest of the district fights over crumbs. Dan Ryan is doing what he can to make the system more fair; allowing Equity Fund dollars to pay for teachers was an important first step in that direction.
While I appreciate Ryan’s good work and intentions, I advocate for the abolition of LSFs. Wealthy donors should be encouraged to donate to the district’s general fund and advocate for real, progressive tax reform, so that we can eliminate our two-tiered school system and all students can have access to a comprehensive education.
Steve Rawley published PPS Equity from 2008 to 2010, when he moved his family out of the district.
29 Comments
November 11, 2009
by Kenneth Libby
Earlier this week, the Oregon Department of Education released report cards for the state’s schools. The scoring system is a new formula that, in my opinion, actually makes testing even more high-stakes. I’m not sure that’s beneficial to our children, teachers, or schools. Here’s a run-down of how this new scoring mechanism works, courtesy of The Oregonian :
A school’s achievement index shows how well it succeeds at teaching reading and math, on a scale from 0 to 133.
A school gets 133 points for every student who exceeds the grade-level standard in reading or math, 100 points for students who meet the standard and 100 points for students who begin far below grade level and reach an ambitious growth target.
For students who neither meet benchmarks nor the growth target, the school gets no points. For minority, special education, limited English and low-income students, the score is doubled — 0 out of 266 possible if the student falls short,200 if he meets, 266 points if the student exceeds. The score for each student is averaged into a schoolwide index. Elementary and middle schools must score 90 points to be outstanding; high schools must score 80 points. A score below 60 lands an elementary or middle school in need of improvement; a score below 50 does that to high schools
Here is a summary of the correlation (not causation) between the new index scores, percent of students qualifying for free and reduced lunches, and percentage of ELL students (via PASW, formerly known as SPSS). These data tables and graphs looked only at the 56 traditional elementary schools and K-8 schools. No, I’m not a statistician – but there’s an awfully strong correlation between the variables.

And a graph of percent of students on F/R lunch (x) vs. index score (y):

And percent of ELL students (x) vs. index scores (y):

And poverty (x) vs. ELL students (y):

Sourced from: Our Global Education
Kenneth Libby is an independent education researcher and a recent graduate of Lewis and Clark's Graduate School of Education and Counseling. He writes about national education issues, testing and philanthropy on Schools Matter and Global Ideologies in Education.
Comments Off on Charting the correlation between poverty, ELL, and state report cards
July 24, 2009
by Steve Rawley
On Our Global Education, Kenneth Libby dissects the source of Mayor Sam Adams’ and school board member Pam Knowles’ erroneous claim of a forty-something percent dropout rate in Portland Public Schools.
The source? A Gates Foundation-funded study. The actual dropout rate is something less than 37%. The study counts 63% of students graduating (57% within four years of starting ninth grade and another 6% within five years), but cannot account definitively for the remaining 37%. Some are dropouts, but some transfer to schools that use different accounting, for example.
Steve Rawley published PPS Equity from 2008 to 2010, when he moved his family out of the district.
3 Comments
July 12, 2009
by Kenneth Libby
This article is reprinted with permission. It originally appeared on the author’s blog Global Ideologies in Education –Ed.
Portland Business Alliance COO Pam Knowles recently won a seat on the PPS school board. She ran against Scott Bailey in a high-price race for the zone 5 seat. Knowles spent $34,030 on her campaign and Bailey spent $33,561 to publicize his candidacy. This begs a few questions: does this de facto “pay to play” policy lock out particular communities, viewpoints, or opinions? Who can raise $30,000 for a high-involvement volunteer position while maintaining a job and raising a family? These questions become even more relevant when considering the election process in Portland: anyone can vote in any zone’s election. (See also this open thread for previous discussion of these issues. –Ed.)
The election process has turned into a media campaign complete with campaign managers, corporate donations, media budgets, and the presentation of false statistics (more on this later; let’s just say Knowles either has no idea what she is talking about or is knowingly misleading the public).
 Location of Pam Knowles’ campaign donations larger than $100
The map above shows the sources of 57 donations to Knowles’ campaign. Several of them are in her district, but the vast majority aren’t even on her side of the river. All of this information is available here through OreStar, Oregon’s election reporting website. These 57 donations account for around $15,000 of Knowles’ $34,030 campaign; the other donations were less than $100 apiece and do not require documentation. I have no doubt that Knowles had the support of some people in her district — some of those sub-$100 donations were from voters in her district — but she certainly pulled in her biggest chunks of funding from the West side (and Portland businesses).
What is Knowles saying that makes the business sphere take note? First, Knowles claims we have a 42% dropout rate. She pushes for “stabilizing funding” for the schools without calling for taxes on businesses (she’s also the COO of the Portland Business Alliance; do you think they like the new tax hikes?). She practically screams efficiency and accountability in the voters’ pamphlet — all while suggesting the K-8 model is here to stay because “research” says it’s better. Added insult: part of that “research” is an overt attack on teachers (they’re more “accountable” in the K-8 model). Question for Pam: why do we have the K-8 model only in one part of town while another part of town (the wealthier side) gets a 6th grade academy and then a 7/8 grade school for middle school?
The claim of a 42% dropout rate isn’t unique to Pam; the Mayor has made the same claim as well (although I informed the Mayor’s office of their error and it sounds like Sam understands the issue). I’ll elaborate on the dropout statistic soon — but I can tell you that Knowles is intentionally misleading the public or completely misinterpreted educational studies (or she never bothered to read them).
Kenneth Libby is an independent education researcher and a recent graduate of Lewis and Clark's Graduate School of Education and Counseling. He writes about national education issues, testing and philanthropy on Schools Matter and Global Ideologies in Education.
6 Comments
February 13, 2009
by Steve Rawley
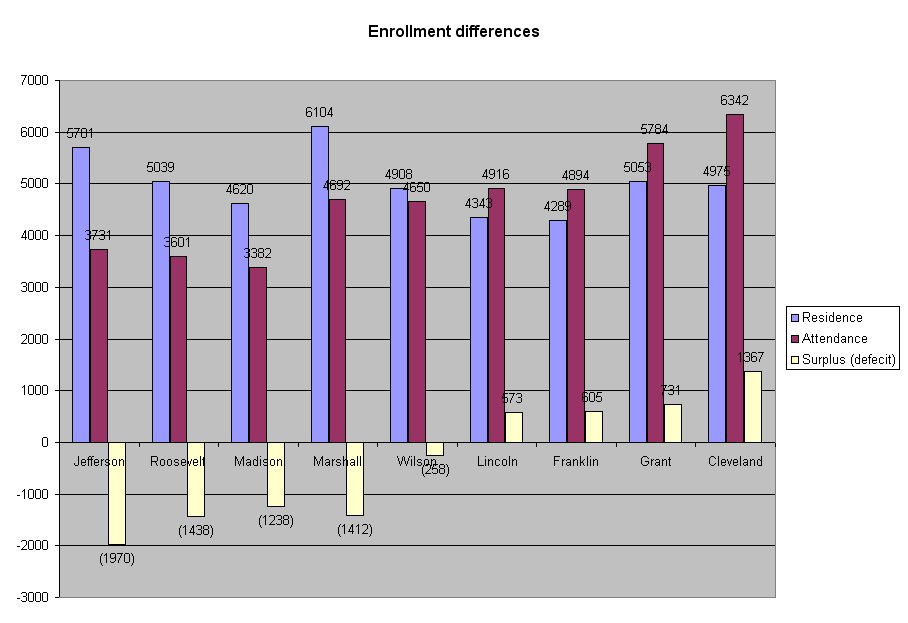
2008-2009 PPS student migration
Percentage of enrollment gained (or lost) due to student migration (compared to cluster population)
Student population vs. enrollment
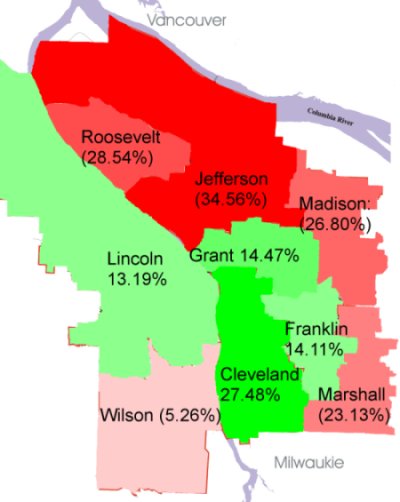
Availability of comprehensive secondary schools correlated with race and poverty
| cluster |
# comp. high schools |
# comp. middle schools |
% non-white by residences |
% free/reduced meals by residence |
| Jefferson |
0 |
0 |
67.48% |
61.39% |
| Roosevelt |
0 |
1 |
67.6% |
72.30% |
| Madison |
0 |
0 |
61.95% |
61.77% |
| Marshall |
0 |
1 |
57.96% |
72.79% |
| Wilson |
1 |
2 |
24.57% |
20.80% |
| Lincoln |
1 |
1 |
21.60% |
9.30% |
| Franklin |
1 |
1 |
35.05% |
38.52% |
| Grant |
1 |
2 |
32.85% |
23.17% |
| Cleveland |
2 |
2 |
27.16% |
30.15% |
Note: teacher experience and student discipline rates also correlate highly to race and poverty; that is, average teacher experience is lower and discipline referral rates higher in schools serving high poverty, high minority populations. Data for the current school year are not yet available for these factors.
Data source: Portland Public Schools.
This report is available in PDF format (240KB).
Steve Rawley published PPS Equity from 2008 to 2010, when he moved his family out of the district.
15 Comments
October 12, 2008
by Steve Rawley
How student transfers, “small schools,” and K8s steal opportunity from Portland’s least wealthy students, and how we can make it right
When speaking with district leaders about the glaring and shameful opportunity gap between the two halves of Portland Public Schools, it doesn’t take long before they start wringing their hands about enrollment.
“If only we could get enrollment up at Jefferson (or Madison, Marshall or Roosevelt),” they’ll tell you, “we could increase the offerings there.”
Or, as PPS K8 project manager Sara Allan put it in a recent comment on Rita Moore’s blog post about K8 “enrichment”: “All of our schools that are small … face a massive struggle to provide a robust program with our current resources.”
Not to pick on Sarah, but this attitude disclaims responsibility for the problem. After all, the “smallness” of schools in the PPS “red zone”* is by design, the direct result of three specific policies that are under total control of PPS policy makers:
- the break-up of comprehensive high schools into autonomous “small schools”
- the transition from comprehensive middle schools to K8s, and
- open transfer enrollment.
Smallness is not a problem in and of itself, but it is crippled by a school funding formula in which funding follows students, and there is little or no allowance for the type of school a student is attending (e.g. small vs. comprehensive or K8 vs. 6-8).
So when you’re dealing with a handicap you’ve created by design — smallness — it’s a little disingenuous to complain about its constraints. Instead, we need to eliminate the constraints — i.e. adjust the school funding formula — or redesign the handicap.
Adjusting the school funding formula to account for smallness would be ideal, if we had the funding to do it. Since we don’t, this would mean robbing Peter to pay Paul. That is, we would have to reduce funding at other schools to pay for smallness brought on by out-transfers, the K8 transition, or the small schools high school model. This obviously hasn’t happened, and it would be political suicide to suggest we start.
So barring a new source of funding to reduce the constraints of smallness, we need to redesign smallness.
The easiest case is the “small schools” design for high schools. Where students have been constrained to one of three “academies,” with varying degrees of autonomy, we simply allow students to cross-register for classes in other academies. Instead of academies, call them learning communities. Instantly, students at Madison, Marshall and Roosevelt have three times the curriculum to choose from. The best concepts of “small schools” — teachers as leaders and a communities of learning — are preserved.
For K8s, the problem is simply that we can never offer as much curriculum with 50-150 students in what is essentially an elementary school facility as we can offer at a middle school with 400-600 students. So we offer a choice: every middle grade student can choose between a comprehensive middle school or continuing in their neighborhood K8. Reopen (or rebuild) closed middle schools in the Jefferson and Madison clusters, and bolster those in the Roosevelt and Marshall clusters. Families in every cluster then have the choice between a richer curriculum of a middle school or the closer attention their children may receive with a smaller cohort in a K8. We all like choice, right?
Which brings us to the stickiest wicket of the smallness problem: open transfer enrollment, which conspires with K8s and “small schools” to drain nearly 6,000 students from the red zone annually (that’s 27% of students living in the red zone and 12% of all PPS students). We’re well-acquainted with the death spiral of out-transfers, program cuts, more out-transfers, and still more program cuts. It has reached the point that it doesn’t even matter why people first started leaving a school like Jefferson.
If you look at Jefferson now, compared to Grant, for example, It’s shocking what you see. Not counting dance classes, Jefferson offers 38 classes. Grant offers 152.
What kind of “choice” is that? (Disclaimer: both the Grant and Jefferson syllabi listings may be missing courses if teachers have not yet submitted their syllabi.)
Obviously, given funding constraints, we can’t afford to have a school with 600 students offer the same number of classes as one with 1,600, as district leaders will readily point out. What they’re not fond of talking about is the budget-neutral way of offering equity of opportunity in our high schools: balance enrollment.
All of our nine neighborhood high schools have enrollment area populations of 1,400-1,600. Jefferson and Marshall, two of our smallest high schools by enrollment, are the two largest attendance areas by residence, each with more than 1,600 PPS high school students.
With a four-year phase-in (keeping in mind that transfers into Lincoln, Grant and Cleveland have basically been shut-down for a couple years anyway), you start by making core freshman offerings the same at every neighborhood high school. Incoming freshman are assigned to their neighborhood school, and they don’t have to worry about it being a gutted shell. (Transfers for special focus options will still be available as they are now.) The following year, we add sophomore classes, and so on, and in four years every neighborhood high school has equity in core sequences of math, science, language arts, social studies, world languages and music, paid for without additional funding and without cutting significant programs at schools that are currently doing well.
Once we have this balance in place, both in terms of offerings and enrollment, we can talk about allowing neighborhood-to-neighborhood transfers again, but only as we can afford them. In other words, we will no longer allow a neighborhood program to be damaged by out-transfers.
It’s time for Portland Public Schools to stop blaming its opportunity gap on the smallness it has designed — by way of “small schools,” K8s, and open transfer enrollment — and it’s time for policy makers to stop transferring the costs of smallness to our poorest students in terms of dramatically unequal opportunities.
—
*I define the red zone as clusters with significant net enrollment losses due to student transfers: Jefferson (net loss of 1,949 students), Madison (1,067 students), Marshall (1,441 students) and Roosevelt (1,296 students). (2007-08 enrollment figures.) This represents, by conservative estimate, an annual loss of $34 million in state and local educational investment to the least-wealthy neighborhoods in Portland. “Small schools” were implemented exclusively in these four clusters, and the K8 transition, though district-wide, has disproportionately impacted the red zone. There are only two middle schools remaining in the red zone, one in the Roosevelt cluster and one in the Marshall cluster. By contrast, the Cleveland and Wilson clusters each have two middle schools; Franklin, Grant and Lincoln each have one.
Steve Rawley published PPS Equity from 2008 to 2010, when he moved his family out of the district.
15 Comments
« Previous Entries