The numbers paint a picture
February 13, 2009 6:12 pm
2008-2009 PPS student migration
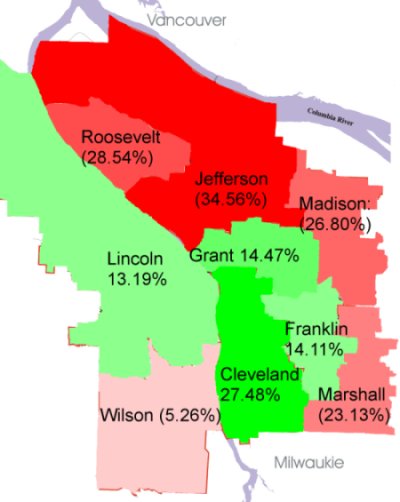
Percentage of enrollment gained (or lost) due to student migration (compared to cluster population)
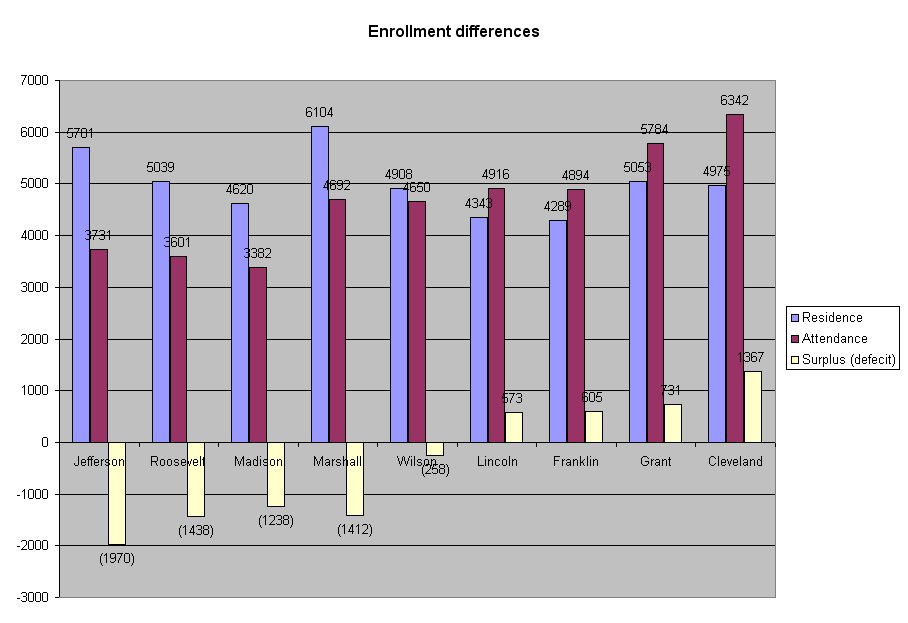
Student population vs. enrollment
Availability of comprehensive secondary schools correlated with race and poverty
| cluster | # comp. high schools | # comp. middle schools | % non-white by residences | % free/reduced meals by residence |
|---|---|---|---|---|
| Jefferson | 0 | 0 | 67.48% | 61.39% |
| Roosevelt | 0 | 1 | 67.6% | 72.30% |
| Madison | 0 | 0 | 61.95% | 61.77% |
| Marshall | 0 | 1 | 57.96% | 72.79% |
| Wilson | 1 | 2 | 24.57% | 20.80% |
| Lincoln | 1 | 1 | 21.60% | 9.30% |
| Franklin | 1 | 1 | 35.05% | 38.52% |
| Grant | 1 | 2 | 32.85% | 23.17% |
| Cleveland | 2 | 2 | 27.16% | 30.15% |
Note: teacher experience and student discipline rates also correlate highly to race and poverty; that is, average teacher experience is lower and discipline referral rates higher in schools serving high poverty, high minority populations. Data for the current school year are not yet available for these factors.
Data source: Portland Public Schools.
This report is available in PDF format (240KB).
Steve Rawley published PPS Equity from 2008 to 2010, when he moved his family out of the district.
filed under: Data Crunch, Demographics, Elections, Equity, Facilities, Features, High Schools, K-8 Transistion, Middle Schools, Transfer Policy

February 13th, 2009 at 7:37 pm
Brilliant! Thanks for organizing and sharing this information. According to the district’s boundary map it looks like Franklin has only one middle school (Mt. Tabor). Cleveland has three (da Vinci, Hosford, and Sellwood). da Vinci may not be a “feeder” to Cleveland but it is within its boundary.
February 13th, 2009 at 8:55 pm
Marian, according to PPS, daVinci is located physically in the Grant cluster, but is not part of any feeder pattern. Likewise for Benson in the Cleveland cluster. (Benson alone counts for most or all of the Cleveland cluster’s enrollment gains, which certainly bears mentioning.)
February 13th, 2009 at 11:48 pm
So, have you distributed this to the Superintendent’s Transfer and Enrollment Committee?
February 14th, 2009 at 9:10 am
np, it’s on the agenda for Tuesday’s meeting of SACET (Superintendent’s Advisory Committee on Enrollment and Transfer).
A couple more notes: funding follows enrollment, so this migration pattern indicates a large transfer of public investment out of the neighborhood schools serving our most poverty-affected, most minority students.
The enrollment lost from the “red zone” is greater than the enrollment gained in the “green zone.” This is because students transferring to charter schools, community-based alternatives and special services, are not counted as part of a cluster, and thus can be considered “lost” altogether to neighborhood schools. It may be safe to assume that the lack of comprehensive secondary schools in the red zone contributes to the demand for charter and alternative schools.
February 14th, 2009 at 10:10 am
Ridiculous k-8 school boundaries due to school closures and mergers also account for enrollment loss from neighborhood schools in the red zone. Vernon and Woodlawn are two good examples, but there are plenty of others.
I hope the Transfer and Enrollment Committee will do a long overdue boundary review as part of their work. Families should be assigned to a neighborhood school closest to their home when possible, and kids shouldn’t have to cross dangerous arterial roads to get to school.
February 16th, 2009 at 6:57 pm
PPS says da Vinci is located in the Grant cluster? Apparently they don’t know how to read their own maps. Sorry to burst their bubble, but that area north of Burnside and west of 28th is indeed in the Cleveland cluster–although, as Steve says, extraneous to any feeder pattern. Unless PPS has already redrawn HS attendance boundaries without telling us? At this point, I wouldn’t put it past them—especially in the wake of the recent Marshall/Franklin dust-up that was reported in the Tribune.
February 23rd, 2009 at 12:09 pm
I attended a public meeting last May ( held at Grant High School ) in regards to neighborhood school boundaries-one “example” given by someone from the Transfer and Enrollment Office is Alameda and how it’s ” overcrowded “,-not due to lottery transfers but moreso just many kids living in the Alameda boundary. I suspect at some point, the Jefferson cluster will be broadened while the Grant cluster will shrink. The “example” given at that meeting leaned towards shifting students from Alameda over to Vernon ( due to a boundary change). Something to watch out for, but I am sure if PPS does this, the boundary will most likely be carved out based on property values ( already seems to be the case with part of the Grant boundary north of Fremont…it ends somewhere around Skidmore ).
February 23rd, 2009 at 8:23 pm
Do you know that Grant grew at the expense of Jeff years ago? I think it was back in the ’80’s (and anyone out there feel free to correct me if I am wrong), that Boise-Eliot and Tubman were reassigned from Jefferson to Grant. Now Tubman is a 6-12 girls’ academy, but as far as I know, Boise-Eliot is still part of the Grant cluster. So if your prediction were to come true, some might view it as Jefferson getting back a piece of their own.
February 24th, 2009 at 9:24 am
Of course boundaries will be based on segregation of less affluent families. Just ask the Rose City Park families about the boundary change to 57th Ave. Granted it did solve the split feeder issue, but the families west of 57th could have been reassigned to Madison. That could’ve boosted Madison’s economic diversity. Do you suppose the district is waiting for rising property values and gentrification to bring class diversity to schools?
Alameda is an interesting case. Already very full, their boundary was increased during the reconfiguration. Enrollment data show that in 2006-07 there were 445 neighborhood kids and 233 transfers. For 2007 to 2008 Neighborhood students total 498 and transfers 199. Thats a reduction in transfers from 34% to 28%. What is Alameda’s enrollment goal to keep enough FTE for their program?
February 24th, 2009 at 9:50 am
Well, seeing that Jefferson is at half capacity,it certainly could use more students, however, if you look at the area the Jefferson cluster takes up compared to that of Grants…to me, it looks like the Jefferson boundary is already considerably larger than Grants. Lincolns appears to be the largest however, I believe it has the fewest minorites. I was mainly getting at how PPS seems to draw their boundary lines…around property values perhaps.
February 24th, 2009 at 9:58 am
Looking at # of students by area of residence, Jefferson is the second biggest (click on the chart above for a larger view). Lincoln has a large geographic area, but a large part of it is uninhabited (Forest Park). It is the second smallest cluster by student population.
Here are the number of PPS students living in each cluster, in descending order:
Adjusting attendance area boundaries is a little pointless when the largest clusters by residence have the lowest enrollment.
Boundary change discussions must be coupled with meaningful reform of our enrollment and transfer system.
February 24th, 2009 at 5:35 pm
What happened to Madison?
February 24th, 2009 at 5:39 pm
Oops, left off Madison; I corrected it above.
February 24th, 2009 at 6:01 pm
The Jefferson attendance area appears large but about half of it has almost no population. A big chunk is industrial land north of columbia Blvd.
February 26th, 2009 at 11:38 am
Hi all. I’m an on and off poster here. I have a kid at Alameda and live about 5 blocks from the school. The more telling numbers to look at are the “transfer slots and applicants” numbers on the lottery page of the PPS website. I’ve posted these numbers on the Grant Cluster forum of PPS Equity before, so I won’t repeat that now (and I don’t have the bandwidth to redo that here today). But, a few years back, as recently as when the current fourth graders were incoming kindergarteners, our former principal would tell parents at the round up that she would make room for any child who wanted to come to Alameda. Since then, there have been fewer and fewer transfers every year as empty-nesters have moved out of the neighborhood and young families have moved in, mainly for the school. This year we’re taking four transfers, all of whom are siblings of current students. I believe last year we also took siblings only.
Steve, mentioned that boundary changes don’t matter as long as the liberal transer policy is in place. I think that’s probably right and the cluster populations posted above bear that out, as does Steve’s amazing map.